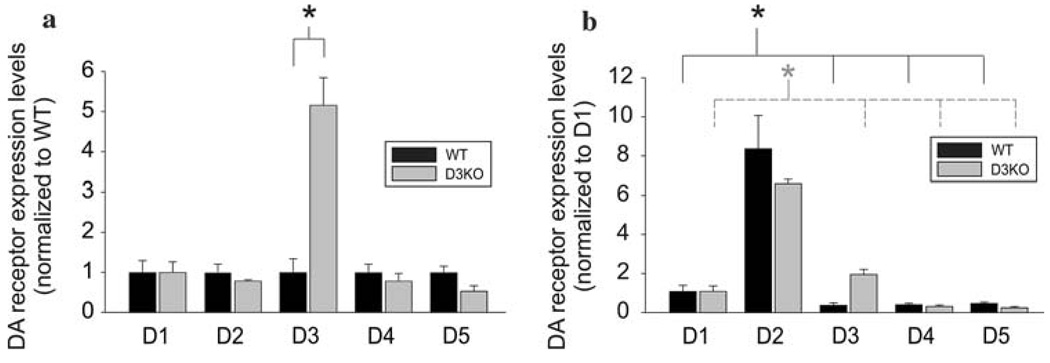
Fig. 1.
Quantitative real-time PCR of dopamine (DA) receptor mRNA expression in wild-type (WT) (black bars) and D3 receptor knockout animals (D3KO, n = 3 each) (gray bars). a Comparison of expression levels between WT and D3KO normalized to WT expression. There was no significant difference between WT and D3KO for D1, D2, D4, and D5 receptor subtypes (D1: P = 0.99; D2: P = 0.37; D4: P = 0.48; D5: P = 0.09). In contrast, D3 receptor mRNA expression was significantly enhanced in D3KO (P = 0.005). Values are expressed as mean ± SE. b Expression levels are normalized to D1 expression levels of WT and D3KO, respectively. In both WT and D3KO, D2 receptor mRNA expression was significantly greater than all other DA receptor expression values respectively (P < 0.005 for both WT and D3KO comparisons)

