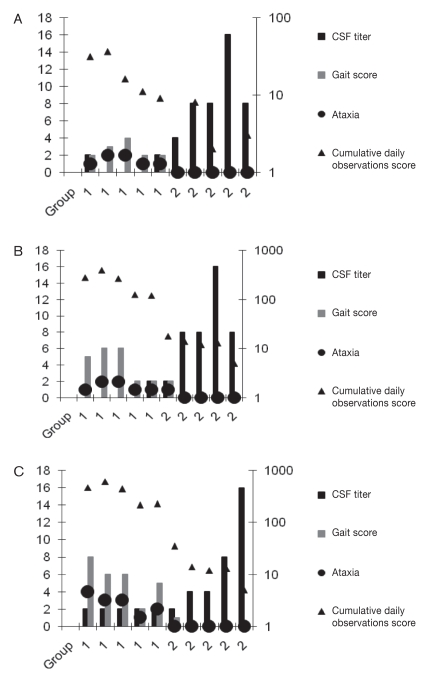
Figure 1.
Neurologic scores and titers for the control group (1) and rSAG-1 vaccinated group (2) on study day 64 (A), 91 (B), and 125 (C). Note that the cerebrospinal fluid (CSF) titer, gait score, and ataxia are plotted on the left axis; the cumulative daily observations score was plotted on a logarithmic scale, right axis.

