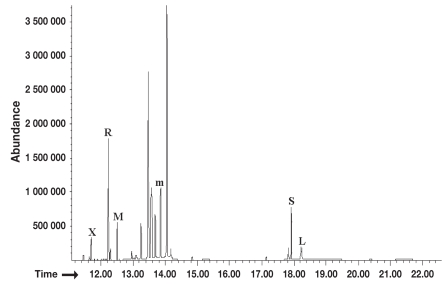
Figure 1.
Representative total ion chromatogram. This figure shows a representative ion chromatogram for the 5 target sugar probes spiked in pooled canine serum samples at a concentration of 125 mg/L. Labeled peaks indicate major peaks of xylose (X), rhamnose (R), methylglucose (M), sucrose (S), lactulose (L), and the internal standard mannitol (m).

