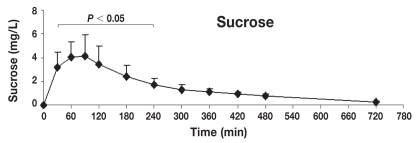
Figure 6.
Concentration-time profile of sucrose [mean ± standard deviation (s)]. This figure shows the changes of sucrose concentrations in serum after orogastric administration in healthy dogs (n = 8). Serum concentrations of sucrose were significantly different from baseline at 30, 60, 90, 120, 180, and 240 min post-dosing (P < 0.05), reaching the maximum peak concentration at 90 min post-dosing (means ± s: 4.1 ± 1.7 mg/L).

