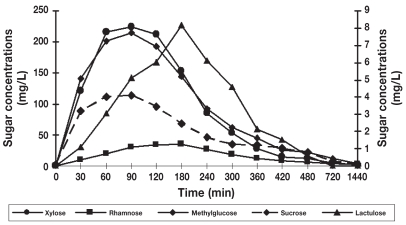
Figure 7.
Serum concentration-time curves of the 5 sugars after orogastric administration. Serum concentrations of xylose, rhamnose, and methylglucose are displayed on the y-axis on the left. Serum concentrations of lactulose and sucrose are displayed on the y-axis on the right. For all 5 sugars, no significant differences were found between concentrations measured at 90, 120, and 180 min time points or between the coefficients of variation (CV%) of the mean concentrations of these 3 points.

