Figure 1.

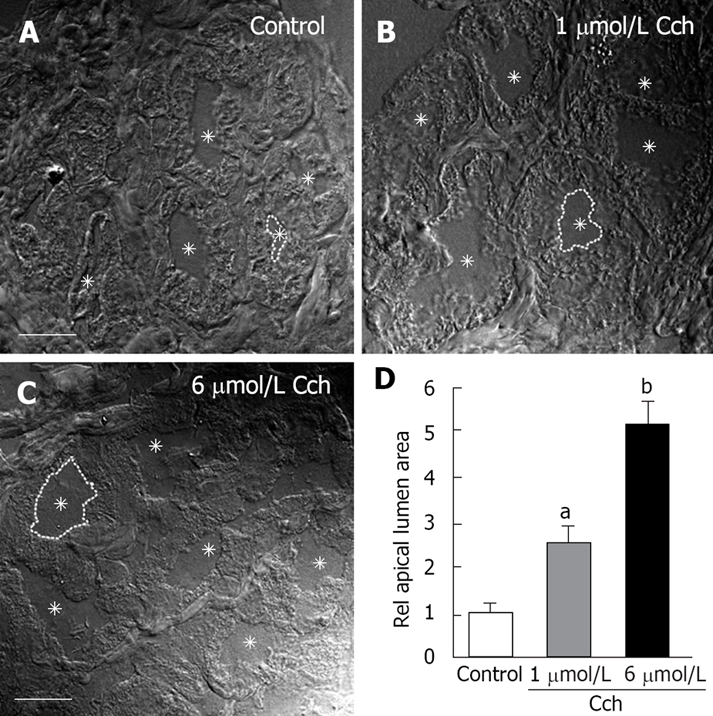
Carbachol-evoked dilatation of Brunner’s gland acinar lumens. A-C: Representative differential interference contrast (DIC) images of control (A), 1 μmol/L Carbachol (B), and 6 μmol/L Carbachol (C) showing a dose-dependent dilation of the acinar lumen. In each panel, the lumens are indicated by asterisks and one of the lumens is highlighted with a broken line. D: Statistical analysis of apical lumen area relative to control. For each condition 50 glands from 3 different sets of animals were measured (n = 150). Only those glands where the complete acinus was contained in the section were studied. Scale bar = 10 μm. aP < 0.05, bP < 0.01.
