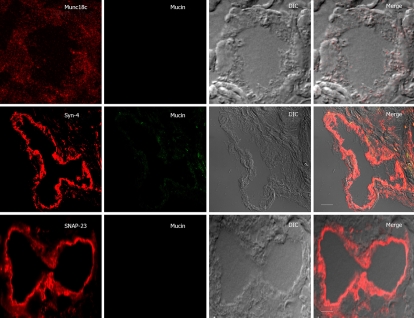
Figure 4.
SNARE localization after low carbachol (1 μmol/L) stimulation of Brunner’s gland acini. Confocal images of 1 μmol/L carbachol-stimulated Brunner’s gland acini labeled with anti-mucin antibody (in green) and double labeled with anti-Munc18c, Syntaxin-4 or SNAP-23 antibodies (in red), and an overlay (merge) of the two with the DIC, which is also separately shown. Note the loss of apical plasma membrane staining of Munc18c with some staining in the cytosol, and much reduced mucin staining. Scale bars correspond to 10 μm.

