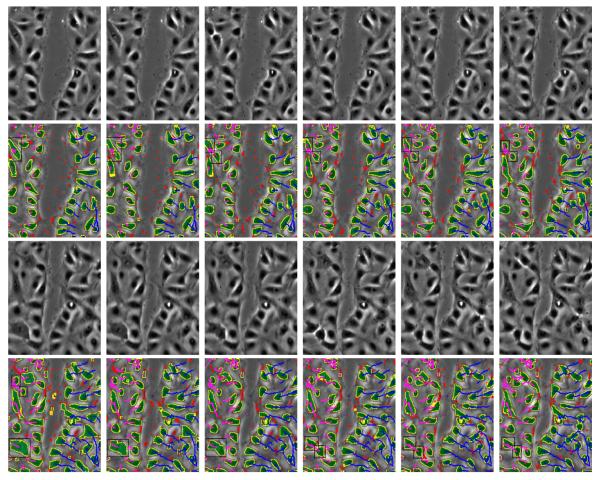
Fig. 1.
First row: Original frames 13-18. Second row: Segmentation and tracking results for frames 13-18. Third and fourth rows: Original frames 24-29 and results. Trajectories shown in rows 2 and 4 start from the first frame. Color key: yellow - post-processed contours, red - spurious contours, green - cell masks, blue and purple -trajectories, black - bounding box of the cell nuclei in the process of cell-division.

