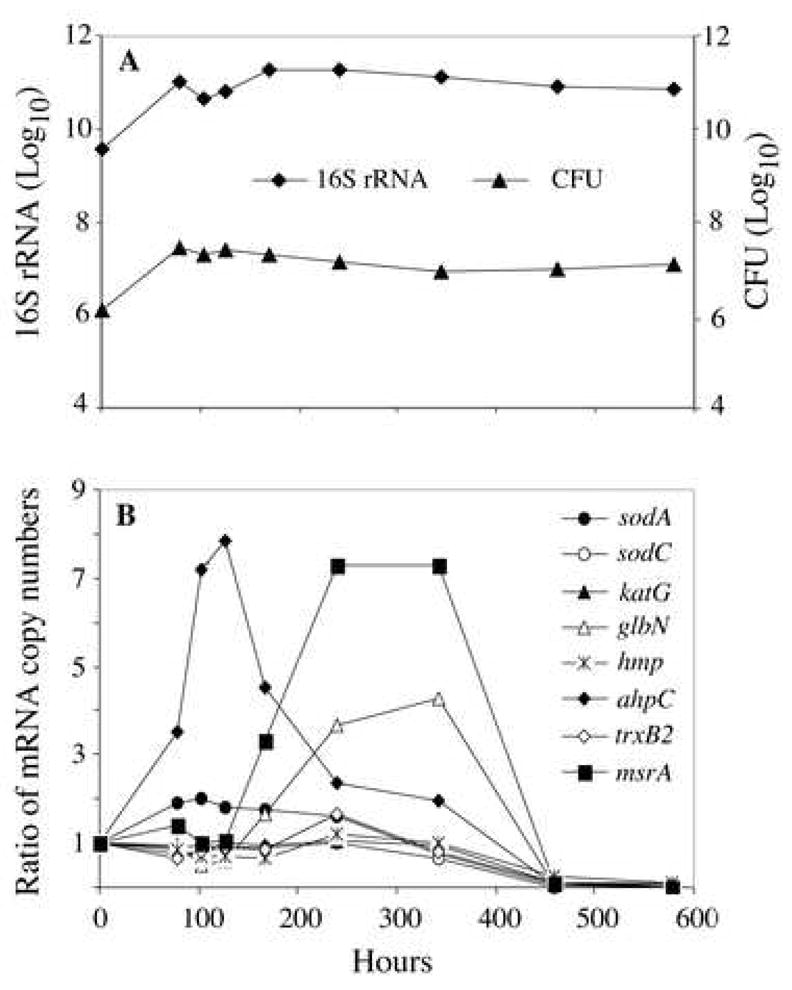
Figure 2. M. tuberculosis growth and changes of bacterial transcripts encoding antioxidant enzymes in liquid cultures during adaptation to gradual oxygen depletion.

M. tuberculosis was cultured under conditions of gradual O2 depletion established by Wayne and Hayes 21. Bacterial RNA was extracted, and transcripts were enumerated by real-time RT-PCR with molecular beacons. Panel A: M. tuberculosis growth curve and 16S rRNA levels. Panel B: Changes of M. tuberculosis transcripts encoding antioxidant enzymes during gradual oxygen depletion. Levels of transcripts per cell were obtained by dividing mRNA copy number by the corresponding 16S rRNA copy number. Shown are ratios of normalized mRNA copy numbers determined at hour 78, 102, 126, 168, 240, 342, 460 and 578 relative to aerated mid-log cultures (hour 0). Replicate experiments produced similar results.
