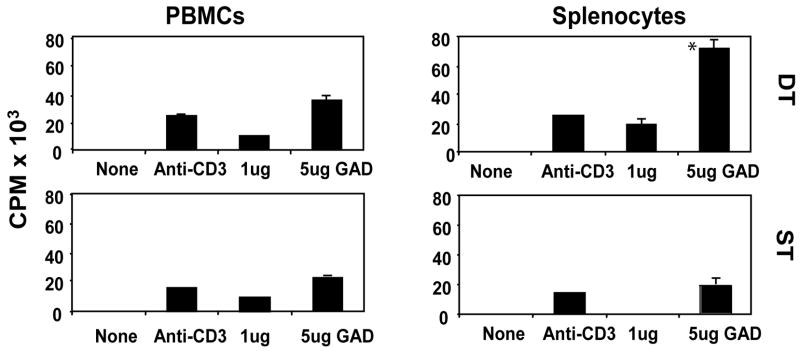
Figure 4. Cellular immunity in immunized mice.
T-cell proliferation assays were performed using peripheral blood mononuclear cells (PBMCs, left panel) and splenocytes (right panel). DNA-immunized animals’ results shown. Radioactivity from radiolabeled thymidine incorporation to proliferating T cells is expressed in CPM × 103 (Y axis, left margin). DT indicates double transgenics (DQ8-RIP7-hGAD65) while ST indicates single transgenics (GAD65 ST shown). None = no antigen added (negative control), Anti-CD3 was used to stimulate proliferation (positive control). Mean and standard deviation of triplicate results from 5 animals in each group (double or single transgenics) is shown. All double-transgenic animals tested had significant central (splenocytes) antigen specific proliferative responses to hGAD65 (top right) when compared to single-transgenic mice (bottom right).

