
Figure 7.
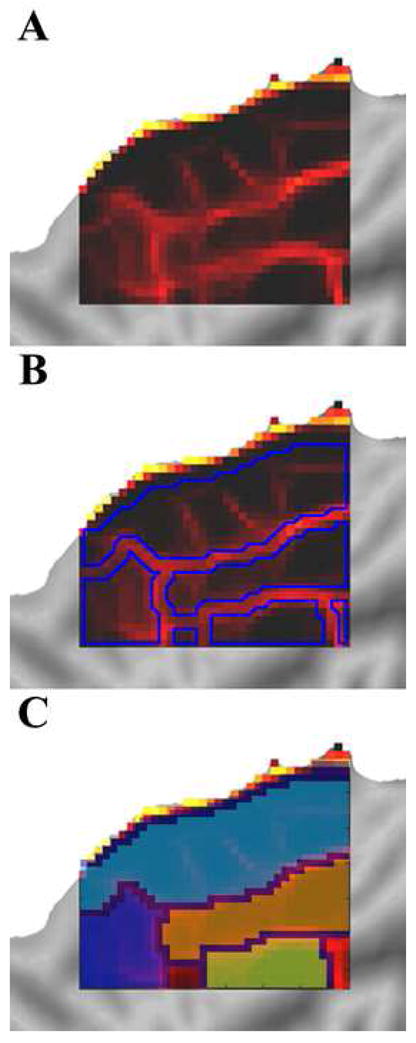
Panel A shows the rs-fcMRI derived boundaries generated above. Applying a watershed image segmentation algorithm parses the patch into contiguous non-overlapping regions least likely to be edges (i.e. most likely to be areas) shown in panel B, which can then be individually identified and labeled for investigation and validation as shown in panel C.