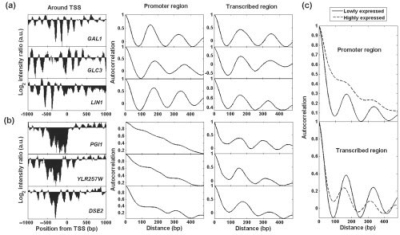
Fig. 1.
Nucleosome occupancy intensities, autocorrelation patterns and gene expression levels. (a) and (b) are six gene examples. From left to right are intensity ratio signal, autocorrelation in promoter and transcribed region. In (a) are three lowly expressed genes: GAL1 (0.04), GLC3 (0.32) and LIN1 (0.08). The number in the bracelet following gene name represents gene expression level. Three highly expressed genes are shown in (b): PGI1 (4.03), YLR257W (3.75) and DSE2 (4.13). (c) Average autocorrelation profiles for top 250 highly expressed (dashed lines), bottom 250 lowly expressed genes (solid lines) in promoter and transcribed region, respectively.

