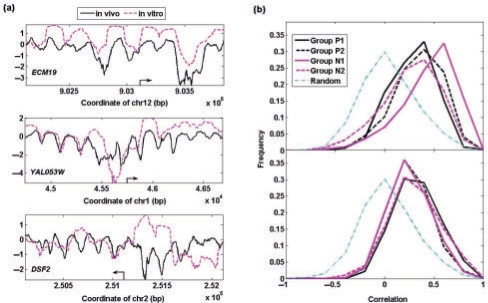
Fig. 4.
(a) Comparison of the in vivo nucleosome intensity with the in vitro nucleosome occupancy data for three genes as examples; (b) distribution of correlation between nucleosome intensity in vitro and in vivo for the same gene in terms of different gene groups. As comparison, the dash-dotted lines in the plots are correlation between the in vivo nucleosome occupancy of one gene and in vitro data of another randomly chosen gene.

