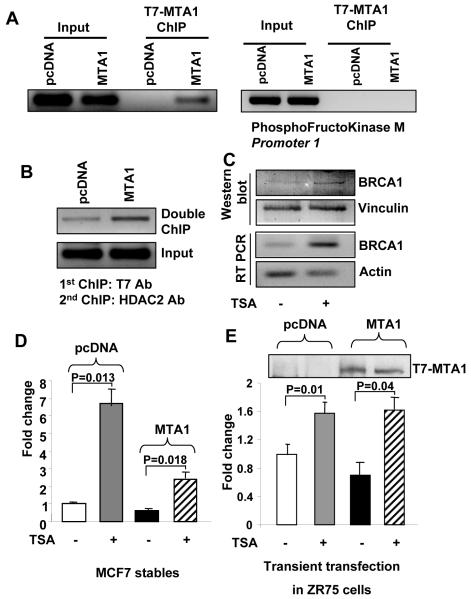
Figure 3. MTA1-mediated repression of the BRCA1 promoter via its atypical ERE site.
A, ChIP assay in MCF7/pcDNA and MCF7/MTA1 clones with a T7-tag specific antibody. Results demonstrate the physical association of MTA1 with BRCA1 promoter chromatin and not with the PhosphoFructokinase M promoter chromatin. B, Double or sequential ChIP in MCF7/pcDNA and MCF7/MTA1 clones. Results demonstrate the recruitment of both MTA1 and HDAC2 to the BRCA1 promoter, thus implying recruitment of the MTA1-containing NuRD complex to that chromatin region. C, Decreased MTA1-induced repression of BRCA1 at both the protein (first panel, right lane) and mRNA levels (third panel, right lane) in MCF7 cells treated with the specific histone deacetylase (HDAC) inhibitor trichostatin A (TSA; 300 nmol/L per milliliter of culture medium). Actin expression was used as an internal control. Functional assay of pGL3 BRCA1-luciferase activity demonstrating the effect of TSA treatment on MTA1-mediated repression of BRCA1 expression in MCF7 cells. In brief, MCF7 pcDNA and MCF7 MTA1 over expressing cells were treated with TSA (D) or ZR75 cells were transiently transfected with a pcDNA or T7-tagged MTA1 expression construct (1μg) and then treated with TSA (E). Western blot for T7 in TCA precipitated luciferase samples shows efficient transfection (above the bar chart). The TSA treatment relieved MTA1-induced repression of BRCA1, thus implying that HDACs were involved in such repression.

