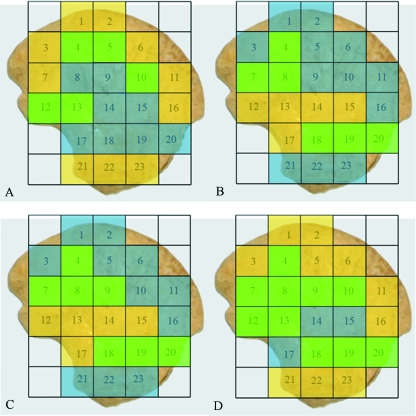
Fig. 7.
Coloured map representing regional groupings with statistically similar trabecular characteristics taken from Table 2A–D. (A) High (yellow), medium (green), low (blue) bone volume fraction (BV/TV). (B) High (yellow), medium (green), low (blue) trabecular thickness (Tb.Th). (C) High (yellow), medium (green), low (blue) trabecular separation (Tb.Sp). (D) High (yellow), medium (green), low (blue) trabecular number (Tb.N).

