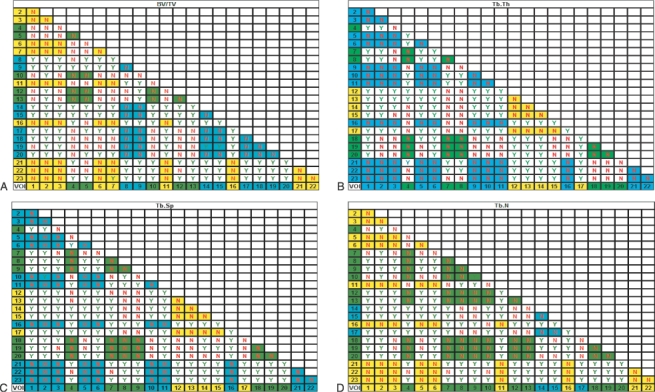
Table 2.
Pairwise multiple comparison of parameters between individual volumes. Non-parametric data were produced using Dunn's test. Statistical output has been summarized to illustrate which volumes are statistically similar, as such, Y, significant difference; N, no significant difference. Regional groupings have been coloured to aid interpretation. (A) High (yellow), medium (green), low (blue) bone volume fraction (BV/TV). (B) High (yellow), medium (green), low (blue) trabecular thickness (Tb.Th). (C) High (yellow), medium (green), low (blue) trabecular separation (Tb.Sp). (D) High (yellow), medium (green), low (blue) trabecular number (Tb.N)
 |
