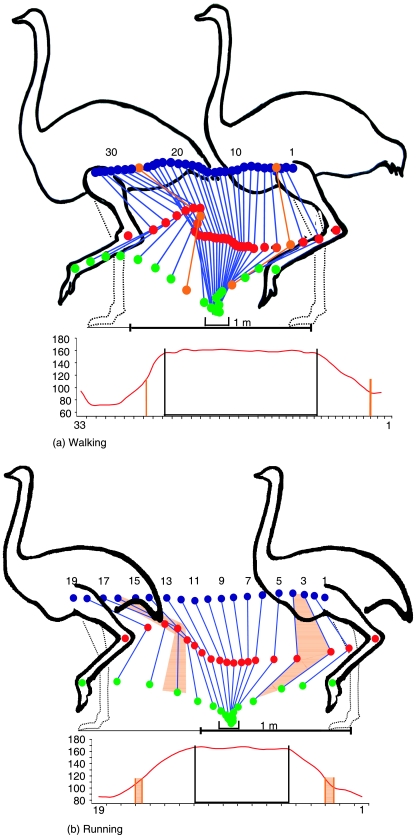
Fig. 5.
(a,b) Kinematic analysis of stride cycle and EDM in walking and running. Blue points = knee joint, red points = intertarsal joint, green points = metatarsophalangeal joint. Orange lines/areas indicate the limb configuration where EDM transition occurs (either in extension before touch-down or in flexion after toe-off) during the swing phase of the stride cycle. One point/number represents one video frame (25 frames = 1 s). The black brackets show the period of ground contact. The corresponding graphs at bottom (not to same scale) show flexion/extension angles of the intertarsal joint over a full motion cycle; black brackets indicate ground contact time, orange lines/areas indicate EDM transition.

