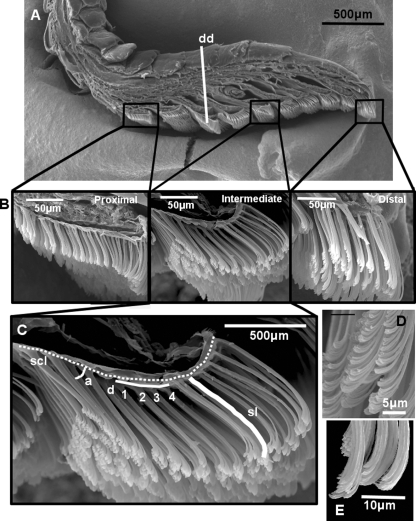
Fig. 2.
SEM images showing digit morphology, scansor location, setal morphology and measurements taken (Rhoptropus diporus is shown). (A) Sagitally sectioned digit showing the general anatomical location of the proximal, intermediate and distal scansors examined. dd, Measurement of digit depth taken at the deepest region of the pad. (B) Magnified view of the proximal, intermediate and distal scansors showing the difference in general configuration. (C) Measurements taken for each scansor: sl, measurement of setal length taken along the midline of the seta from base to tip; d, Measurement of setal density. The horizontal white line represents 32 µm; the number of setae along this line was counted and squared to give setal density per 1000 µm2, scl, measurement of scansor length – dashed line; a, measurement of setal resting angle. (D) Morphology of proximally located setae and (E) morphology of distally located setae.

