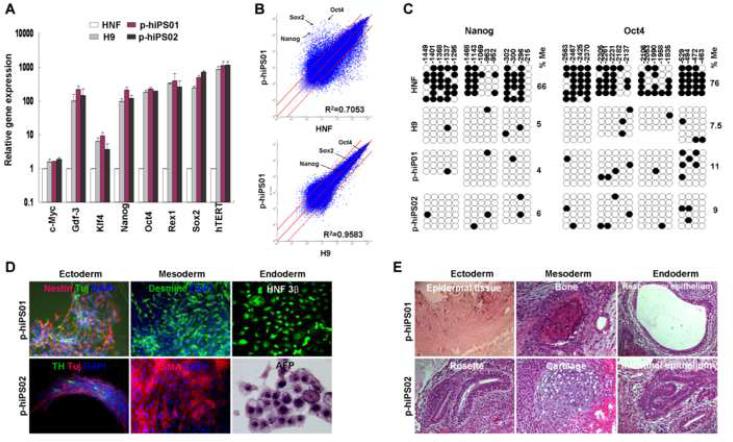
Fig. 2. Characterization of p-hiPS cell lines.
A, Quantitative RT-PCR was performed to assess the expression of c-Myc, Gdf-3, Klf4, Nanog, Oct4, Rex1, Sox2, and hTERT, in p-hiPS01 and p-hiPS02, hES (H9), and HNF cells. Relative gene expression represents fold changes relative to that of HNF cells normalized to β-actin expression. This experiment (repeated twice in triplicate using independently prepared cDNAs) resulted in almost identical patterns. B, The global gene-expression patterns were compared between p-hiPS01 and HNF, and between p-hiPS01 and H9 with Affymetrix microarrays. The red lines indicate the diagonal and 5-fold changes between the paired samples. C, Bisulfite sequencing analysis of the Nanog and Oct4 promoters reveal that almost complete epigenetic reprogramming. Open and closed circles indicate unmethylated and methylated CpG, respectively. Numbers on top show each CpG location. Percentages of CpG methylation (%Me) are shown. D. In vitro differentiation of p-hiPS cells. EBs were made by suspension culture of both p-hiPS lines at day 8 (Far left of the top row panels). Phase contrast (Top row panels) and immunostaining images (second and third row panels) show all three germ layer cells at day 24 including neural (ectodermal), muscle and endothelial-like (mesodermal), and endoderm-like cells (endoderm). E, Teratoma formation in immunodeficiency mice by p-iPS cells. H&E staining were performed for teratomas. The resulting teratomas contained tissues representing all three germ layers: (p-hiPS01, fourth row; and p-hiPS02, bottom row). Ectoderm: epidermal and neural tissue (rosette); mesoderm: bone and cartilage; endoderm: respiratory epithelium and intestinal-like epithelium.

