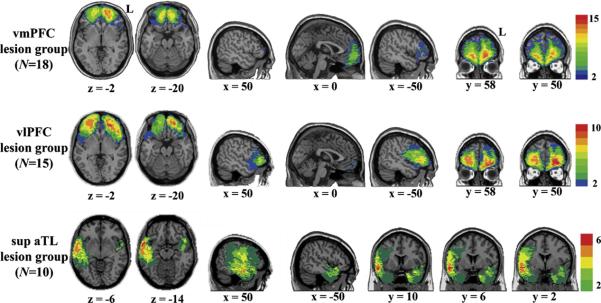
Fig. 2.
Lesion overlaps for the vmPFC, vlPFC and sup aTL groups. Color indicates the number of overlapping lesions at each voxel, with red denoting areas of greatest overlap of lesions among patients, and blue denoting areas of minimum overlap (we used a threshold of 2). There is some overlap between the vmPFC and vlPFC groups. However, lesions extended more laterally in the vlPFC group. It is important to note that this analysis was only confirmatory. The main analysis was the regression analysis, in which we were able to identify the role of each region, while controlling for the extent of damage to other regions. MNI coordinates are given. Abbreviations: vmPFC, ventromedial prefrontal cortex; vlPFC, ventrolateral prefrontal cortex; sup aTL, superior anterior temporal lobe; L, left. (For interpretation of the references to colour in this figure legend, the reader is referred to the web version of the article.)

