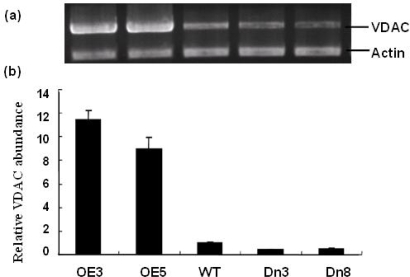
Figure 3.
Identification of the AtVDAC2 transgenic Arabidopsis plants by semi-quantitative analysis. (a) The amplified DNA fragment of AtVDAC2 in different transgenic lines were stained by ethidium bromide in agarose gel and the ralative level in each sample was normalized for actin transcripts. (b) The relative amount of AtVDAC2 mRNA were quantified using a software Gel-Pro analyzer 3.0. OE, Dn, WT represent AtVDAC2 sense lines, anti-sense lines and wild type, respectively.

