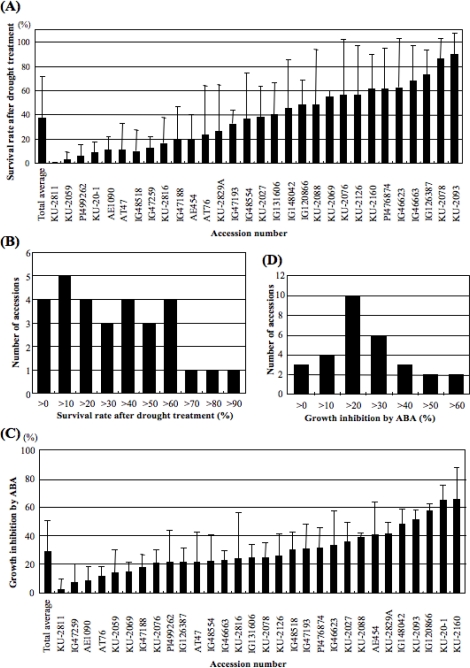
Figure 1.
Natural variation in drought tolerance and ABA sensitivity in 30 Ae. tauschii accessions.
(A) Survival rates (%) after 24 h drought stress. Means ± SDs were calculated from data from three independent experiments. In each experiment, at least 10 plants were tested. (B) Frequency distribution of the drought tolerance levels (%) in the 30 Ae. tauschii accessions. (C) Growth inhibition rate (%) in the presence of 10 μM ABA. Means ± SD were calculated from data from three independent experiments. In each experiment, at least five plants were tested. (D) Frequency distribution of ABA sensitivity in the 30 Ae. tauschii accessions.

