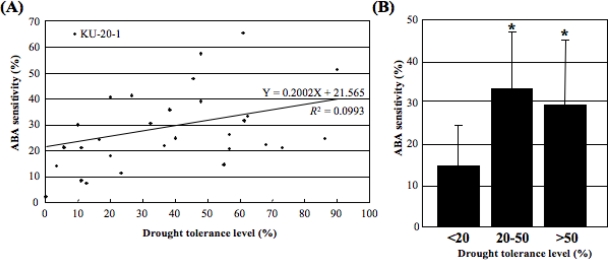
Figure 2.
Correlation between drought tolerance and ABA sensitivity in Ae. tauschii.
(A) Scatter plot showing drought tolerance and ABA sensitivity in 30 Ae. tauschii accessions. (B) Comparison of ABA sensitivity for three Ae. tauschii groups (excluding KU-20-1, which had a distinct level of drought tolerance). Student’s t-test was used to test for statistical significance (*P < 0.05) between the different categories of drought tolerance.

