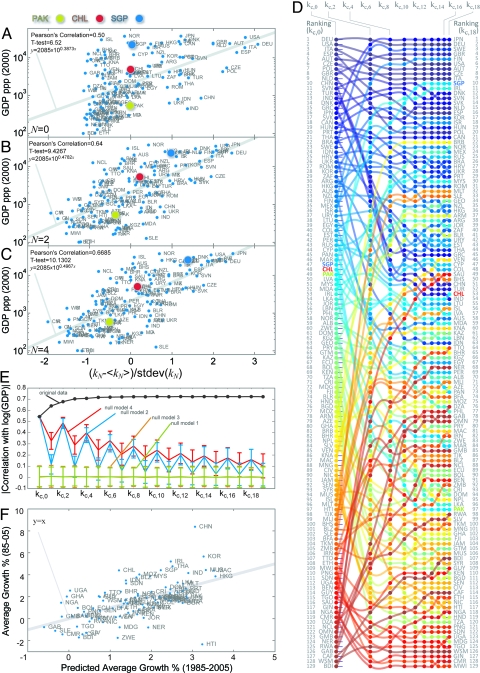
Fig. 3.
Bipartite network structure and income (all GDPs have been adjusted by Purchasing Power Parity PPP). A–E were constructed with data from the year 2000. (A–C) GDP per capita adjusted by purchasing power parity as a function of our first 3 measures of diversification (kc,0,kc,2,kc,4), normalized by subtracting their respective means (〈kc,N〉) and dividing them by their standard deviations (stdev(kc,N)). (A) kc,0. (B) kc,2. (C) kc,4. (D) Comparison between the ranking of countries based on successive measures of diversification (kc,2N) (E) Absolute value of the Pearson correlation between the log GDP per capita at ppp of countries and theit local network structure characterized by kc,N. (F) Growth in GDP per capita at ppp observed between 1985 and 2005 as a function of growth predicted from kc,18 and kc,19 measured in 1985 and controlling for GDP per capita at ppp in 1985.

