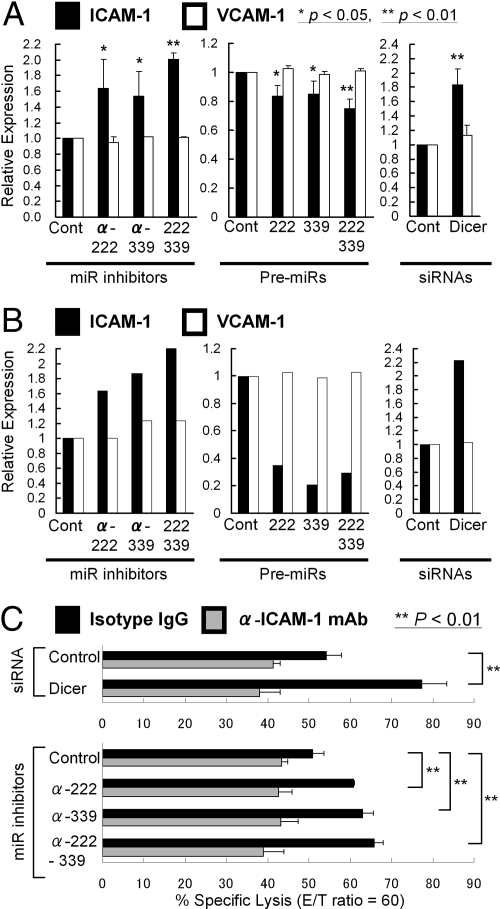
Fig. 5.
Inhibition of Dicer, miRs-222 or -339 recovered ICAM-1 expression in human malignant glioma cells and promoted their susceptibility to CTL. (A and B) Relative ICAM-1 expression (black columns) was evaluated by flow cytometric analyses (A) and Western blotting (B) in U87 cells, in which miR-222, miR-339, or both were inhibited (Left), overexpressed (Middle), or Dicer was inhibited by specific siRNA (Right). VCAM-1 (white columns) was evaluated to determine whether changes in expression levels were specific to ICAM-1. (A) The relative expression level for each cell group was calculated as the relative mean fluorescence intensity (MFI) value to that of U87 cells transfected with the appropriate negative control. Results represent the means of the values from 3 independent experiments. Bars indicate SD. * and ** refer to statistical significance between groups (P < 0.05 and P < 0.01), respectively. (B) The intensity of each specific band was quantified using ImageJ software (see SI Text). The relative expression level of ICAM-1 and VCAM-1 in each cell group was normalized to the β-actin level and calculated as the relative intensity value to that of U87 cells transfected with the appropriate negative control. (C) U87 cells were transfected with control siRNA duplex, Dicer-siRNA duplex, control miR inhibitor, miR-222 inhibitor, miR-339 inhibitor, or both inhibitors before 4 h 51Cr-release assays with PBMCs primed against EphA2883–891 peptide (effector: target ratio was 60:1). Bars represent the percentage of specific lysis in the presence of anti-ICAM-1 mAb (gray bars) or isotype IgG (black bars). The data represent the means of the values from triplicate samples ± SD. **, P < 0.01 for Dicer-siRNA duplex-transfected U87 cells compared with control siRNA-transfected U87 cells; and miR-222 inhibitor-transfected or miR-339 inhibitor-transfected U87 cells compared with control miR inhibitor-transfected U87 cells.

