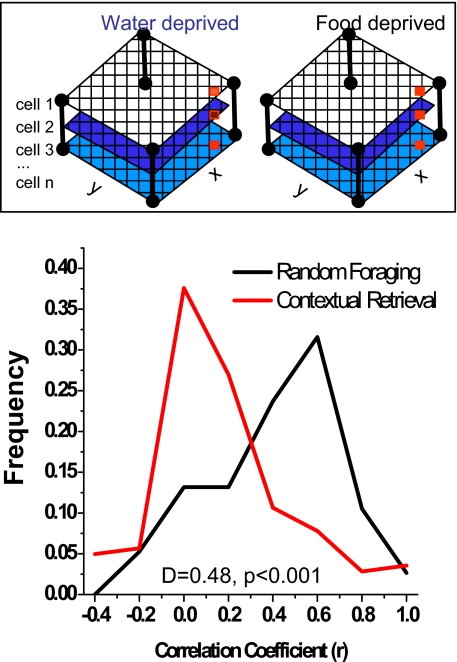
Fig. 5.
Population vector correlations across deprivation conditions. Firing rate vectors represented the activity of all cells (1 … n) in each grid location (x, y) and are depicted by the columns of red squares (Inset). Population vectors from each grid location compared food and water deprivation conditions using Pearson's r; the curves show the frequency distributions of these. Higher r values (x axis) show greater similarity in the ensemble code between deprivation conditions. The vectors distinguished deprivation conditions in the CR memory task (r mode = 0, skewed toward zero; KS test, P < 0.01), but were similar in the RF task where no memory discrimination was required (r mode = 0.6; CR versus RF: KS test, D = 0.48, P < 0.001).

