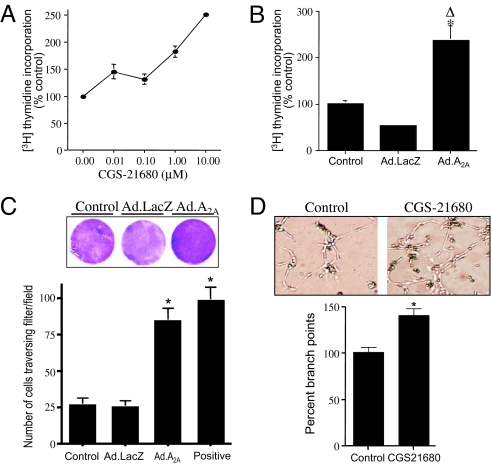
Fig. 3.
Adenosine A2A receptor activation promotes cellular proliferation, migration, and angiogenic activity in primary HLMVECs. (A) Serum-starved cells were treated with varying concentrations of the adenosine A2A receptor agonist CGS-21680 for 24 h in the presence of [3H]thymidine at 1 μCi/mL. (B) Cells were transduced with 10 pfu per cell Ad.LacZ or Ad.A2A receptor. Cells were then serum starved for 24 h and incubated with [3H]thymidine at 1 μCi/mL for an additional 24 h. After [3H]thymidine incorporation, cells were washed and incorporated radioactivity determined in cell lysates. ∗, Statistically significant difference from the nontransduced control cells. Δ, Statistical difference from the Lac-Z transduced controls. (C) Nontransduced, Ad.A2A receptor-transduced, or Ad.LacZ-transduced primary HLMVECs (100,000 per well in a 24-well plate) were plated on fibronectin-coated inserts in serum-free medium. Positive represents nontransduced cells incubated in complete EBM-2 medium containing growth factors and serum. After incubation for 24 h, the lower sides of the inserts were stained with crystal violet and scanned for photography (Magnification: 1×). Photographs were taken of randomly selected fields, and the number of cells per field was quantitated. ∗, Statistically significant difference from the nontransduced and Ad.LacZ-transduced control cells. (D) Primary HLMVECs (100,000 per well in a 24-well plate) were plated on Matrigel (BD Biosciences) in the presence or absence of the A2A receptor agonist, CGS-21680 (1 μM). After incubation for 4 h, fields were randomly selected and photographed (Magnification: 10×). Representative picture shows angiogenic tube formation. Branch points were calculated from 11 random fields from each group and plotted. ∗, Statistically significant difference from control cells.

