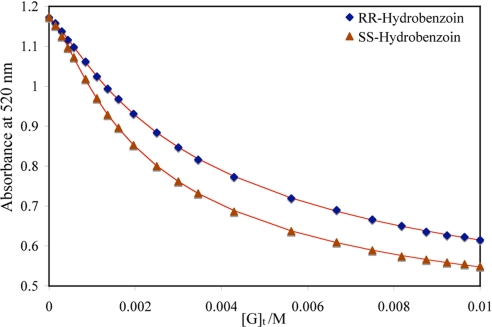
Fig. 3.
A combined graph of 2 enantioselective indicator displacement assay (eIDA) of host (S)-6 (400 μM)/PV (150 μM) with (R,R)-hydrobenzoin and (S,S)-hydrobenzoin, [G]t, concentration of the guest/analyte. All titrations were carried out in 100% MeOH, 10 mM para-toluenesulfonic acid and Hunig's base buffer (pH 7.4). All measurements were taken at 25 °C. The solid lines are calculated curves resulted from iterative data fitting for a displacement assay (8).

