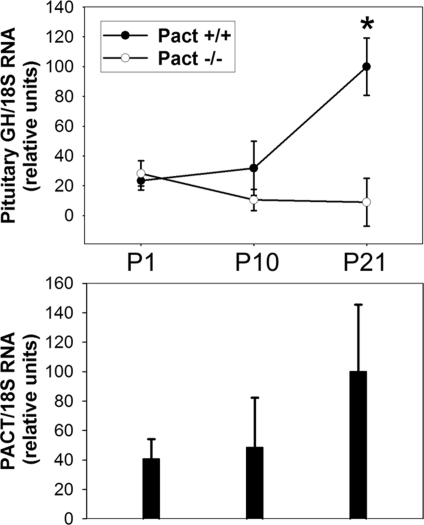
Fig. 4.
Anterior pituitary hypoplasia, as measured by GH mRNA expression, occurs by day P21 in Pact−/− mice. (Top) Quantitative RT-PCR of GH mRNA at P1, P10, and P21 from brain and pituitary. There are fewer GH producing cells in Pact−/− mice by day P21. 18S RNA levels were measured to normalize for body size differences between Wt and Pact−/− animals. Relative values were calculated such that all samples were compared to the P21 Pact +/+ mean, which was set to 100. Pact+/+, n = 3 for each age; Pact−/−, n = 3 for each age. * = P < 0.05, P21 Pact+/+ vs. P21 Pact−/− mice. (Bottom) Pact mRNA levels in brain and pituitary extracts from Pact+/+ mice shown Top at P1, P10, and P21. Real-time RT-PCR was used to quantify Pact mRNA levels. Relative values were calculated such that all samples were compared to the P21 mean, which was set to 100. Similar extracts from the Pact−/− mice showed no detectable PCR product.

