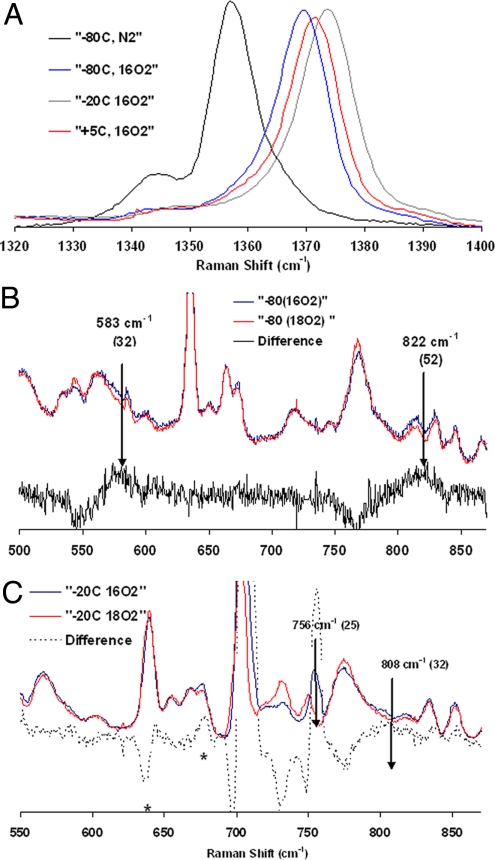
Fig. 4.
rR data obtained with 424-nm excitation, 15-mW power. (A) Data at the high-energy region for the species involved. (B) Low-energy data obtained for sample quenched after addition oxygen at −80 °C. (C) Low-energy data obtained for sample quenched after warming the −80 °C sample to −20 °C. The features at 630 cm−1 and 676 cm−1 in the difference spectrum of the −20 °C sample arise from porphyrin bands of the final decay product.

