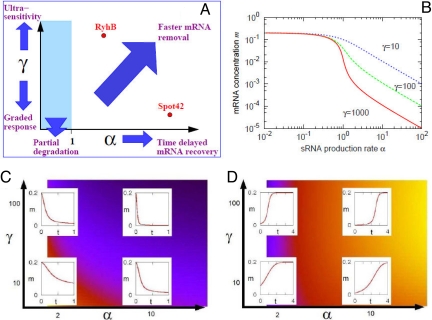
Fig. 2.
Capabilities of sRNA regulation. (A) Schematic diagram showing functional features observed in the model behavior at different values of the parameters, α and γ. These are shown more quantitatively in B–D. (B) The steady-state level of sRNA as a function of α for γ = 10 (blue dotted line), γ = 100 (green dashed line), and γ = 1,000 (red solid line). The value of mRNA concentration m for α > 1 is scaled with 1/γ, which results in a ≈10-fold difference between lines. m changes gradually for small γ, and more abruptly when γ is large (termed “ultrasensitivity”). (C) Dynamics of m (red solid lines) when the value of α is increased, at time 0, from 0.01 to the value shown on the horizontal axis. The background color indicates the time to reach the new steady state, with darker colors indicating shorter times. (D) Dynamics of m when the value of α is reduced, at time 0, from the value shown on the horizontal axis to 0.01. The background color indicates the time to reach the new steady state; darker colors indicate shorter times.

