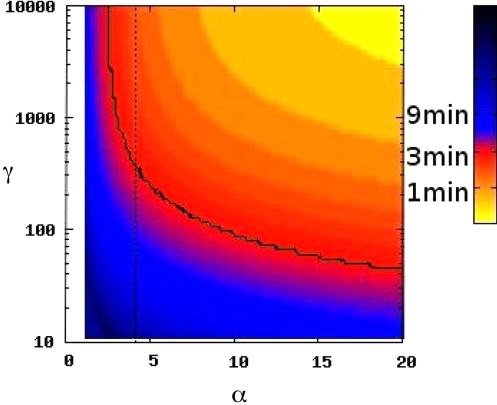
Fig. 3.
Measurement of γ from dynamics of target degradation. The color indicates the time T required, in model simulations, to deplete mRNA levels by 5-fold in respond to a sudden increase of α from near 0 to the value on the x axis. The solid line shows the contour corresponding to 3 min, the time observed in RyhB degradation of sodB mRNA (13). In the simulation, the lifetimes of sodB τm = 5/ln2 min and RyhB τs = 25/ln2 min were used. The dotted line indicates α = 4, the value obtained from our measurements of promoter activities. To calculate α, we assume to have measured all of the target mRNAs of RyhB in Fig. 4. If there are more targets, the computed α value will be less, hence γ will be higher. That is, 4 is an upper bound for α, and 400 is a lower bound for γ. Therefore, our conclusion that RyhB is characterized by low α and high γ is true for sodB.

