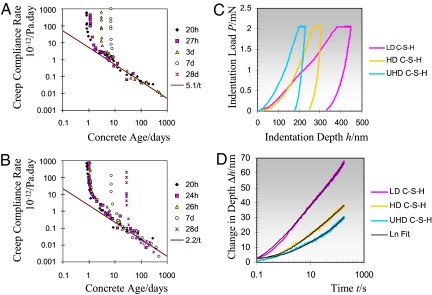
Fig. 1.
Results from creep tests at different scales. (A and B) Macroscopic uniaxial creep compliance rate vs. material age for a normal strength concrete (w/c = 0.5) and a high-strength concrete (w/c = 0.33), loaded in uniaxial compression with a constant load at different material ages (adapted from ref. 3). The long-term creep rate evolves as a power function t−n of exponent n between 0.9 and 1 (14). Macroscopic creep experiments were performed on 16-cm diameter and 1-m long cylindrical concrete samples (47). (C) Characteristic nano-indentation load–indentation depth curves representative of the nano-indentation response of 3 calcium-silicate-hydrate (C–S–H) phases present in cementitious materials (here a cement paste prepared at a w/c = 0.15 mass ratio): low-density (LD) C–S–H; high-density (HD) C–S–H; and ultra-high-density (UHD) C–S–H. After a loading in 10 s, a holding at maximum load for 180 s demonstrates the time-dependent behavior of C–S–H. (D) During the 180-s dwelling time, the change in indentation depth is recorded as a function of time, and fit with a function of the form Δh(t) = x11n(x2t + 1) + x3t + x4. A close inspection of the constants x1, …,x4 shows that x4 = 1.27 ± 1.92 nm and x3 = 0.02 ± 0.02 nm/s (mean ± SD in >2,000 tests) correct respectively for any inaccuracy in the determination of the beginning of the creep phase, and for the drift of the indentation apparatus (details provided in Materials and Methods). The characteristic time 1/x2 ≈ 1.66 s is much smaller than the holding time of 180 s, so that the indentation creep compliance rate L̇ = 2aUḣ/Pmax = 1/(Ct) allows the determination of the contact creep modulus from C = Pmax/(2aUx1), where Pmax is the indentation load kept constant during the holding phase, whereas aU = is the contact radius at the end of the dwelling phase, with Ac the projected area of contact between the indenter and the indented surface determined with the Oliver and Pharr method (22). Here, for the displayed P–h curves, C = 95.0 GPa for LD C–S–H; C = 183.9 GPa for HD C–S–H, and C = 367.6 GPa for UHD C–S–H.

