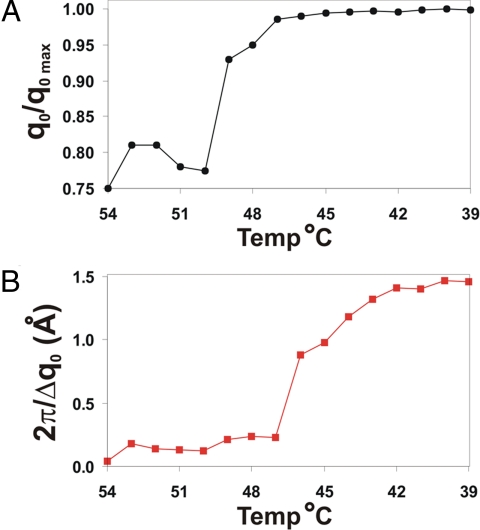
Fig. 2.
Plots demonstrating the growth of crystalline aggregates in the long FCC linker system. (A) Plot of q0/q0max, showing the appearance of NP scattering peaks at 54 °C and the transition to an FCC formation between 50 and 49 °C. (B) Plot of 2π/Δq0, demonstrating the growth in nanocrystal size at temperatures <47 °C, where larger values of 2π/Δq0 indicate larger crystalline domains.

