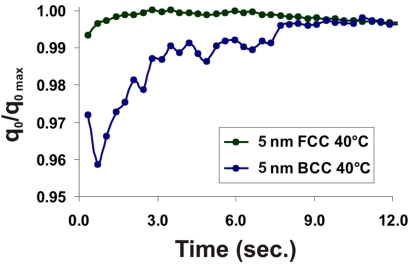
Fig. 4.
Plots of the progression of q0 peak position for FCC (green trace) and BCC (blue trace) crystals. The q0 peak position of maximally ordered crystals is assigned a value of 1.00; the shifts in peak position indicate that DNA-AuNPs designed to give FCC crystals exhibit only a slight shift in q0 position (<1%), whereas those designed to give BCC crystals transition from a more disordered phase on a very quick time scale, but do not reach maximal order for ≈10 s.

