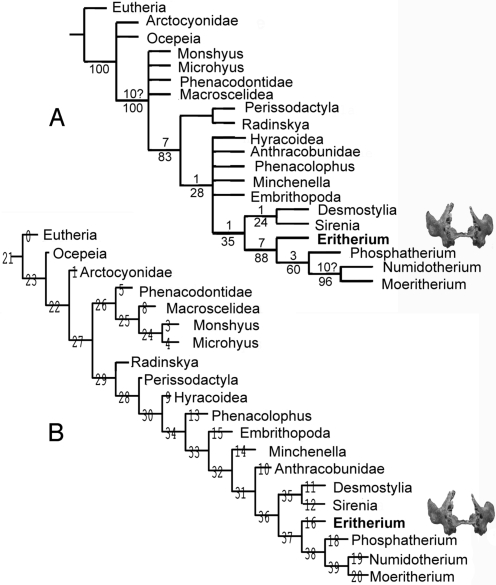
Fig. 3.
Relationships of Eritherium azzouzorum n.g., n.sp. Cladograms resulting from parsimony analysis with TNT program (11) based on modified matrix for Phosphatherium analysis (7) (see SI Appendix). With respect to Phosphatherium analysis (7), several basal taxa are added to test basal relationships of Paenungulata, and Khamsaconus, which TNT “pruned tree” procedure (11) identifies as the most unstable taxon, is excluded from the analysis. (A) Consensus of 14 most parsimonious trees (L = 455 steps, CI = 58.7; CI = 41.8) resulting from exact analysis (nelsen); upper numbers in nodes refer to Bremer indices, lowers refer to bootstrap indices. (B) Standard TNT “implied weighting” analysis (L = 457 steps, RI = 58.4; CI = 41.6) with congruent topology to that resulting from Phosphatherium study (7), in particular with similar primitive position of Anthracobunia and Embrithopoda within Tethytheria. In both cases the proboscidean (basal) relationship of Eritherium azzouzorum n.g., n.sp is well supported.

