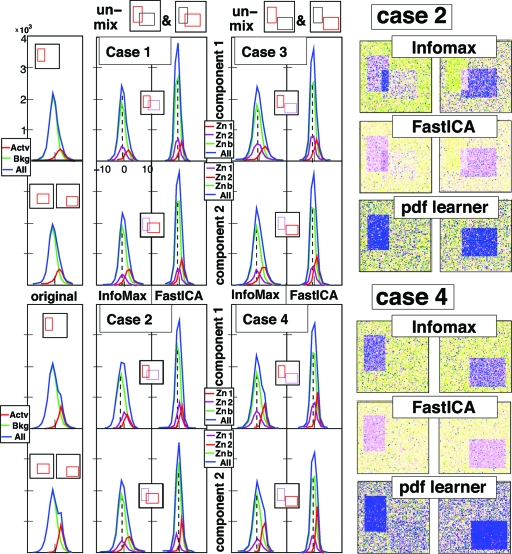
Fig. 3.
Unmixing the 4 mixtures of rectangular components described below. (Left) pdfs of original 2 components, of components as identified by InfoMax and by FastICA. Color coding: the whole (blue), the active region (red), the “background” (green); In the ICA outputs, the purple pdf corresponds to the zone associated to the other component; the background pdf is then for the area outside V1 and V2. Separation is completely successful only when the purple and green pdf line up, i.e., in cases 1, 3 and 4, but not in case 2. (Right) false-color rendition of unmixed components for Cases 2 and 4, as obtained by InfoMax, FastICA, and a more sophisticated ICA algorithm that learns pdf distributions. InfoMax and FastICA do better in Case 4 (separated components) than in Case 2 (independent compoenents); for the pdf-learner it is the converse.

