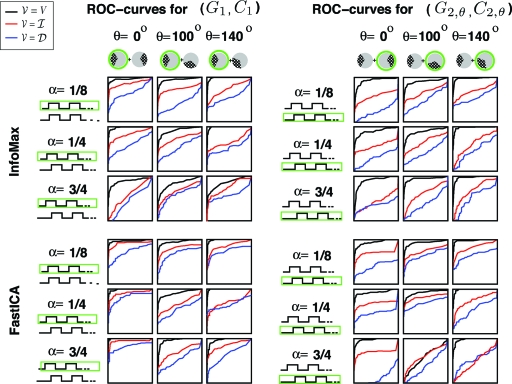
Fig. 7.
The ROC curves obtained for the ICA-computed component, for the choices = V (black), (red) or (blue); the data are those for 1 subject (AW) in the experiment. This is done for 36 cases: 2 components, 2 ICA algorithms (InfoMax or FastICA), 3 different time paradigms, 3 different overlap angles (θ = 100 is the independent case when = ). The comparison is with the ground truth activation patterns G1 (1st component), G2,θ (2nd component).

