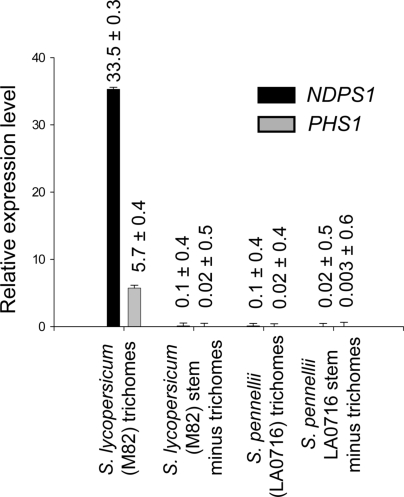
Fig. 2.
Quantitative RT-PCR analysis of NDPS1 and PHS1 gene expression in M82 and LA0716 trichomes. Expression of NDPS1 and PHS1 was measured by qRT-PCR and normalized to expression of EF-1α in total trichomes isolated from stem and petiole tissue and from stem and petiole tissue after removal of the trichomes.

