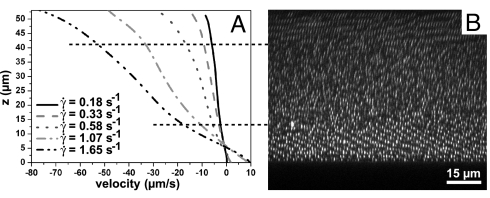
Fig. 1.
Flow profiles of a φ = 0.5 dispersion of 1.2-μm diameter silica particles in ETPTA. (A) Flow profiles measured at several overall applied shear rates. The profiles were not linear; the local shear rate was significantly higher at both the top and bottom plate. (B) Confocal microscopy image of the velocity-gradient plane taken immediately after cessation of the flow and aligned with the flow profiles in A. At both walls, the particles arranged in crystalline layers, but in the middle, the structure was liquid like. Horizontal dashed lines indicate these boundaries and show the correspondence with the flow profiles. The gap width was 53 μm, the bottom plate was at 0 μm.

