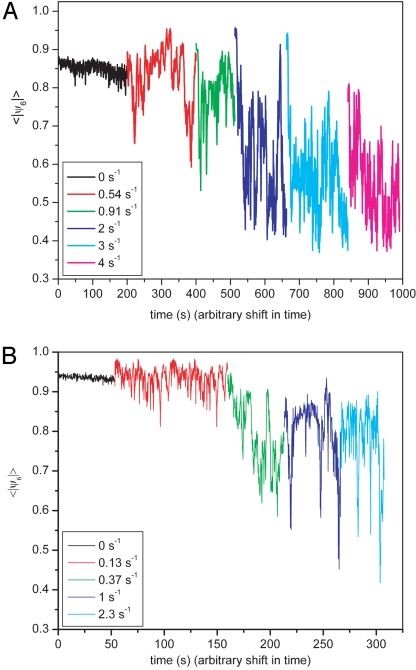
Fig. 4.
The average order, quantified by ψ6, of initially crystalline suspensions sheared at increasing shear rates. (A) The results of a system of 1.2-μm silica particles in ETPTA. (B) The results for PMMA particles in CHB/decaline. The graphs at the different shear rates are shifted horizontally for clarity.

