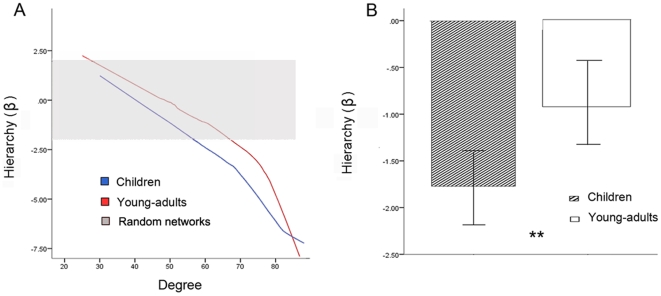
Figure 2. Developmental changes in hierarchical organization of whole-brain functional connectivity network.
(A) Hierarchy measure (β), for children (blue) and young-adults (red) at scale 3 (0.01– 0.05 Hz). The β values for both groups are high (β z-scores ranged from −7.5 to 2.5), and are significantly greater than the β values obtained from random networks (βrandom z-scores ranged from −1.96 to 1.96, indicated in gray). (B) Mean β values were significantly higher in young-adults (indicated by **) compared to children (p<0.01). Error bars represent standard error.

