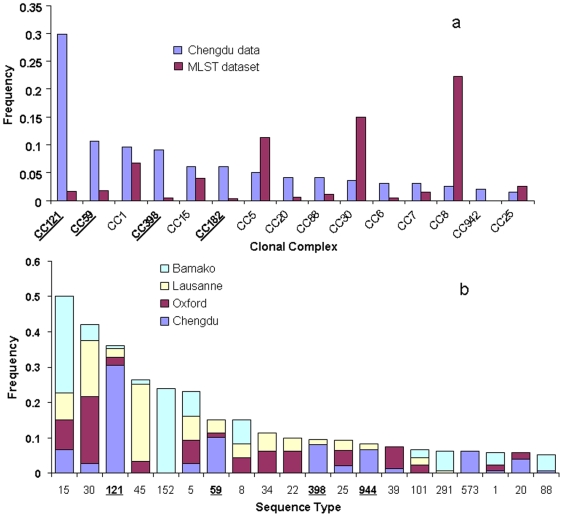
Figure 1.
a The frequencies of the clonal complexes in the combined disease and carriage dataset, and the corresponding frequencies in the MLST website are given. The clonal complexes were delineated using eBURST on the Chengdu data separately (198 isolates) and on the whole MLST dataset. eBURST also outputs the number of isolates belonging to the complex which was used to calculate the frequencies. CCs121, 59, 398 and 182 are all over-represented in the Chengdu data (in bold and underlined). These complexes are related, and all correspond to the major phylogenetic clade Group 1b (see text). In contrast, CCs 5 and 8 are under-represented in the Chengdu data (Group 2), as is CC30 (Group 1a). 1b Comparison of the frequencies of STs within the Chengdu carriage isolates with previous studies of carriage in Europe and Africa (see text for references). Only STs with an average frequency of>1% over the four datasets were included. These comparisons confirm the atypical genotype frequencies noted above (note: ST944 = CC182, ST573 = CC1).

