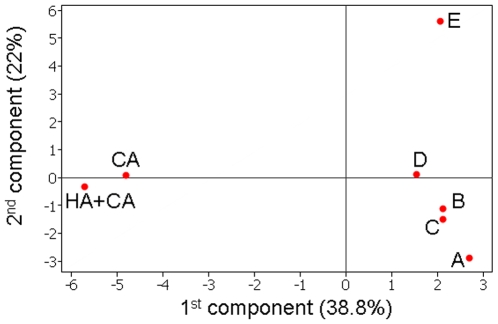
Figure 4. Principal components analysis.
The datasets from the five kindergartens (A–E), the total disease dataset (CA+HA) and just the community-acquired dataset (CA) were plotted according to the two largest components. These accounted for 38.8% and 22% of the variation in the data respectively. The first component separated the disease isolates from the carriage isolates, whilst the second component distinguished between the different kindergarten samples.

