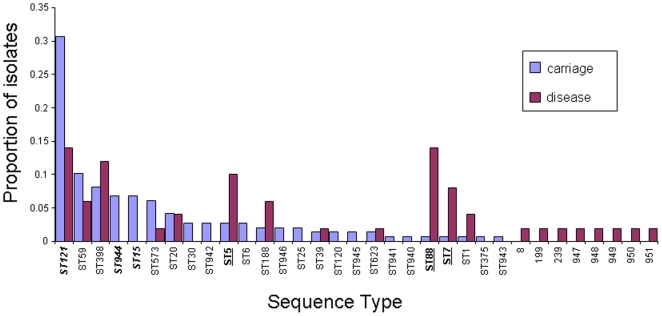
Figure 5. The proportions of each ST noted in the disease and pooled carriage sample.
A resampling procedure showed that STs 121, 944 and 15 were significantly under-represented from cases of disease (bold, italics), whilst STs 5, 88 and 7 were significantly over-represented from cases of disease (bold, underlined).

