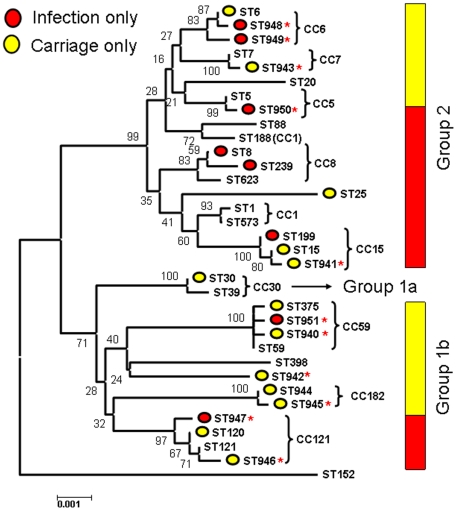
Figure 6. A neighbour-joining tree based on the concatenated sequences of each of the 32 sequence types noted in the combined dataset, as implemented in Mega v4.0 [46] using Kimura-2-parameter distances.
Bootstrap support (based on 1,000 replicates) are given on the nodes. The most basal nodes are reasonably well supported and correspond to the delineation of the three major groups (1a, 1b and 2) identified previously [35]. The grouping of STs into CCs (terminal clusters) is shown by curly brackets. Note the inconsistent position of ST188 (Group 2; CC1), which is a DLV of ST1 but clusters with ST88 on the basis of allele sequences due to recombination. STs which were only noted in the disease sample are marked by a red circle, whilst STs only noted in the carriage sample are marked by a yellow circle. STs common to both datasets are not marked with a circle. Novel STs (first noted in the current study) are marked by a red asterisk. The proportion of isolates corresponding to the disease and carriage datasets are shown by red and yellow bars for Groups 2 and 1b. There is a significantly higher proportion of disease isolates within Group 2.

