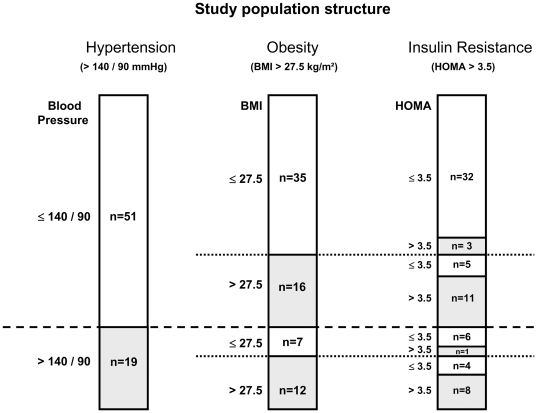
Figure 1. The study population.
The structure of patient cohort is presented with respect to hypertension, obesity and insulin resistance. Bars represent the total number of patients (n = 70); horizontal dotted lines stand for the thresholds for blood pressure, BMI and HOMA-IR, respectively. Numbers within each bar indicate the number of patients within each of the sub-groups having the corresponding indices above or below the thresholds. For example, among hypertensive patients (n = 19; the bar at the left hand side), 7 were not obese (BMI<27.5 kg/m2; the bar in the middle) and 6 of those showed normal insulin resistance (HOMA-IR <3.5; the bar at the right hand side).

