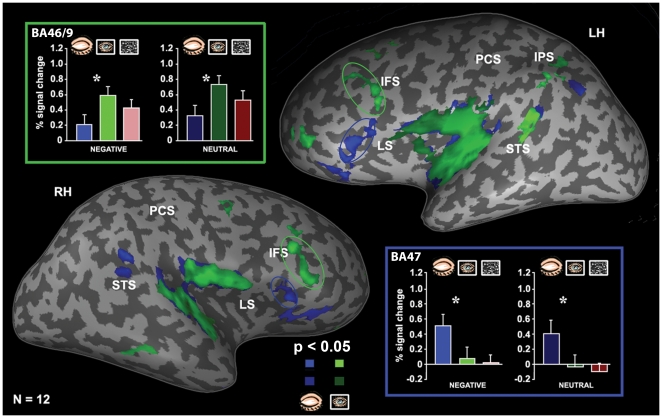
Figure 2. Differences in brain activation with eyes closed, eyes open and activation profiles of ROI.
Functional averaged activation maps (N = 12, p<0.05, random effect) show the cortical activity evoked by musical clips (negative and neutral) presented with eyes closed (blue) and open (green). The maps are superimposed on the left (LH) and right (RH) unfolded hemispheres shown in the lateral view. Quantitative analysis of the activation levels is shown for open (green patches on the maps) and closed (blue patches on the maps) eyes. While the BA 47 (‘blue-framed’ bars, blue circle on the map) exhibited highly preferential activation for eyes closed, the BA 46/9 (‘green-framed’ bars, green circle on the map) demonstrated highly preferential activation for eyes open. STS – superior temporal sulcus, IPS – intraparietal sulcus, PCS – post-central sulcus, LS – lateral sulcus, IFS – inferior frontal sulcus. Error bars, SEM. *, p<0.05.

