
Figure 2.
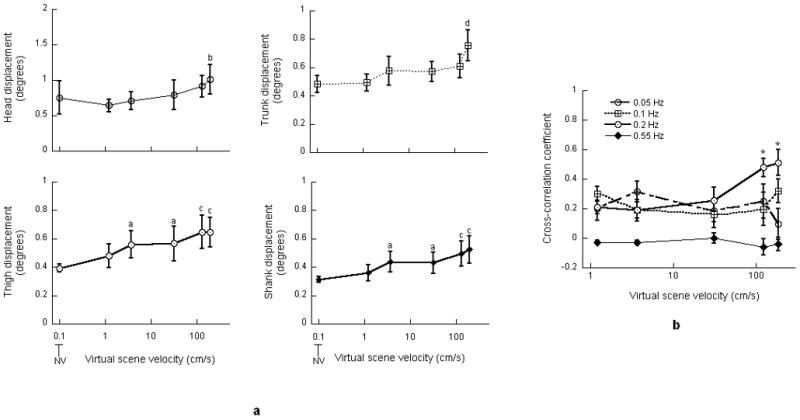
a: Root mean square values of the head, trunk, thigh and shank angular displacement. a indicates significant increase when compared with NV; b indicates significant increase when compared with 1.2 cm/s; c indicates significant increase when compared with NV and 1.2 cm/s; d indicates significant increase when compared with NV, 1.2, 3.7 and 31 cm/s. b: Cross-correlation coefficient between virtual scene and head displacements. * indicates significant increase when compared with scene velocities of 1.2 and 3.7 cm/s. Error bars indicate the standard error of the mean.