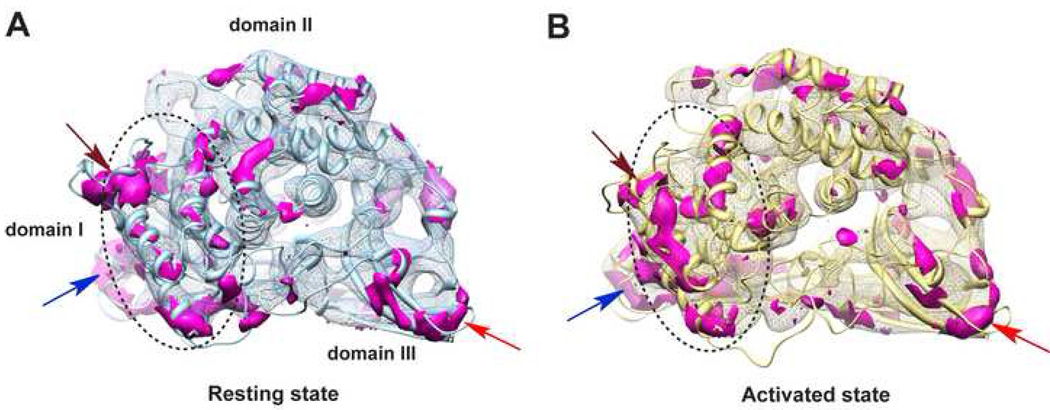
Figure 3. Conformational Variations among the 12 Subunits within an Asymmetric Unit.
(A) 3-D variance map (purple) among the 12 subunit map segments within an asymmetric unit of the resting state illustrating their conformational variations. The variance map is shown in the frame of the corresponding average-map, with a model in light blue ribbon shown to orient the figure. Notably, domain I (highlighted by dotted circle) as a whole shows more pronounced variation than the other two domains. Overall, the outer exposed area tends to have more variations as compared to the interior, especially at the inter-subunit contacting regions indicated by arrowheads (brown, blue, and red).
(B) Variance map among the 12 subunits within an asymmetric unit of the activated state with the same visualization style and labels as in (A).

